Rising PCE price index is sitting at the highest level since 1982, which is 40 years ago.
Unless you are in your 60s or older, you have little memory of inflation at this severe a level. If this sustains for a few more years, the impact will be brutal.
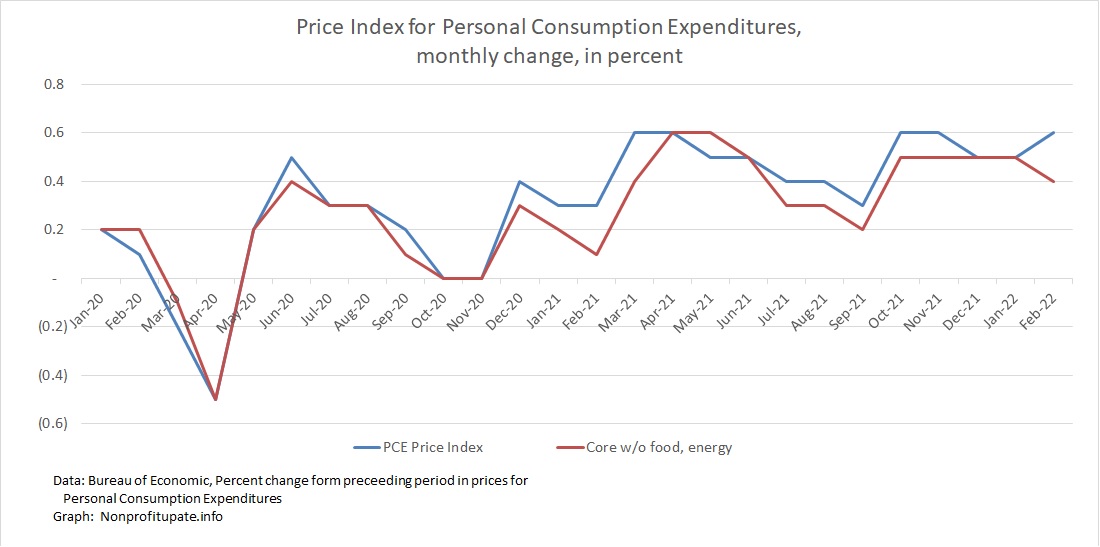
Personal Consumption Expenditure (PCE) inflation index increased 0.6%, which follows 0.5% in January 2022 which was revised downward from 0.6%.
The core PCE inflation rate (without food and energy) was 0.4% in February, following 0.5% rise in January, matching the 0.5% increase for the previous three months. The October 2021 increase was revised up 0.1%.
Consider that the rises in headline and core index are up either 0.5% or 0.6% for each of the last five months. There were lower increases from 0.2% to 0.4% for three months earlier (July, August, September). For the four earlier months (March through June) the headline and core indices were up 0.5% or 0.6%.
That suggests a ongoing solid pattern of half a percent per month. Annualized six percent a year is the current ongoing pattern.
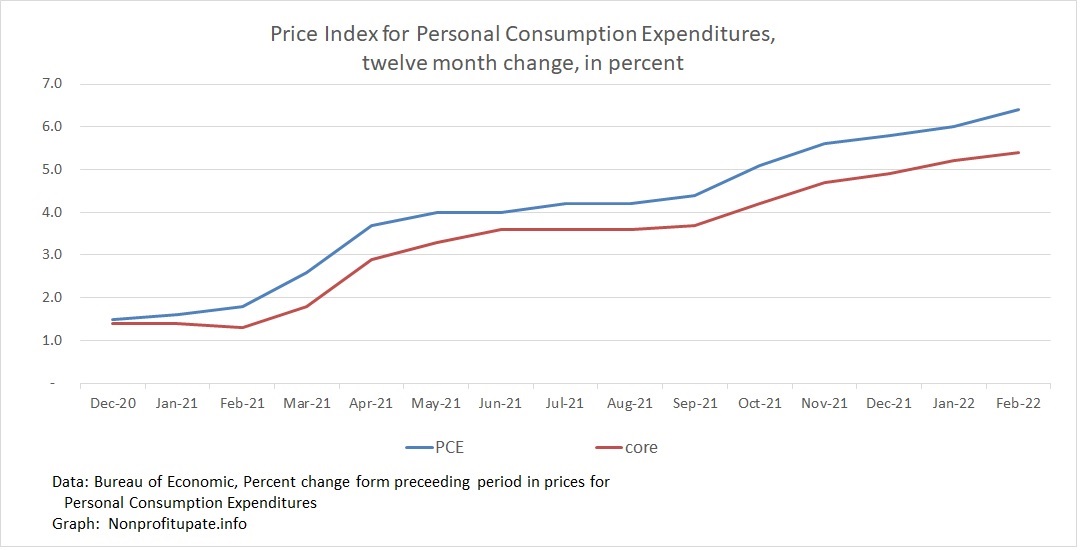
The cumulative 12-month change for 2021, according to BEA, is now sitting at 6.4% overall and 5.4% excluding food and energy.
That is bad. This rate of inflation damage is far outside the experience base of most people.
The PCE is the inflation index preferred by the US Federal Reserve. One aspect of the PCE compared to the CPI is the PCE numbers are routinely revised. This means prior month’s numbers will shift, sometimes by substantial amounts.
Graph at top of this post shows the monthly change in PCE, including the main index and the core index which excludes food and energy.
Inflation as measured by PCE is running hot since December 2020.
The Bureau of Economic Analysis updates their calculation of the year over year change as each month’s data is revised. Their calculation of year over year inflation:
The unsettling part of the high inflation numbers for the last year is what happens if the monthly rate of inflation is sustained over the course of a year.
One depressing tool I learned during the Carter era inflation is to annualize the monthly changes. It is time to do so again.
Following graph shows an average of three months’ change with an annualization of the three-month average.
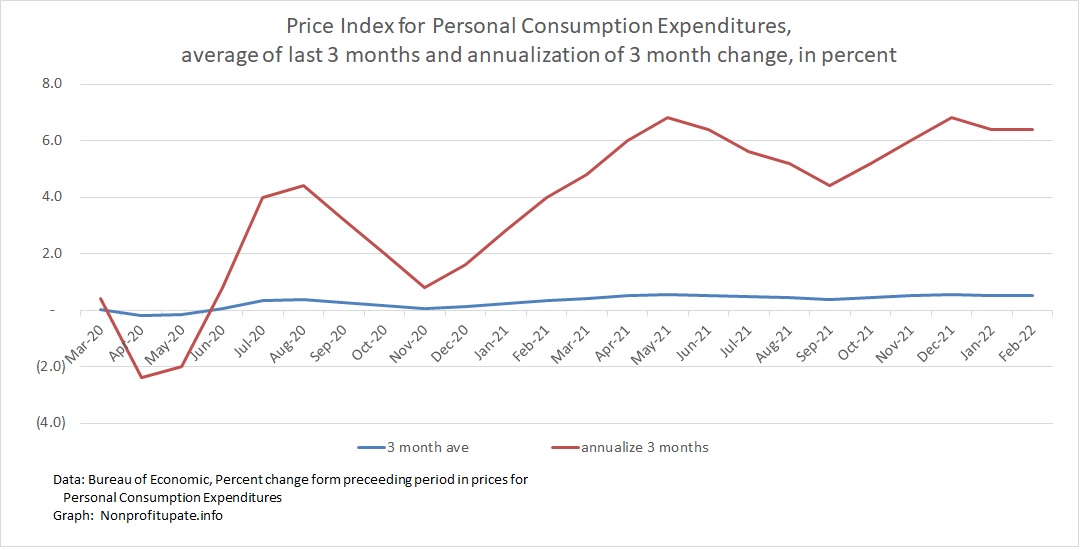
This shows that since March 2021we have been above 4%. For most months the annualized change is in the 5% or 6% range.
For more background on PCE, check out earlier post Monitoring inflation through the Personal Consumption Expenditure (PCE) price index.
0 Comments