“Mass killings under communist regimes”

The article Mass killings under communist regimes at Wikipedia provides a valuable, yet incomplete, compilation of the mass killings carried out by various community regimes.

To make the article more widely available and preserve it for posterity, it is republished here without photographs, excerpts & note, or citations. I may post it again with the extra material. This is a superb summary of the deliberate slaughters carried out by various communist dictatorships over the last century.

A variety of reports provide credible information that communism (and its sibling socialism) willfully killed over 100,000,000 people during the 20th century.  We must remember the death toll knowingly created by communism. Please remember these were intended consequences of deliberately implemented policies.

It is most appropriate to publish this article on Thanksgiving Day as we celebrate the freedom and abundant bounty that God has blessed us with in the United States.

This article is printed with permission of Wikipedia Foundation, Inc. under Creative Commons Attribution-ShareAlike 3.0 Unported license, also referenced as CC BY-SA 3.0. That license allows anyone to share and adapt the licensed material.  Conditions on the license require the material be properly attributed and anyone else may use the material under the same license.

I am publishing the material verbatim as found at Wikipedia without the photos. You may use anything in this post and this post only under the same licence.

For your awareness, remembrance, and future pondering, here is the alternative to capitalism, democracy, and freedom:

Mass killings under communist regimes.

Mass killings under communist regimes occurred throughout the 20th century. Death estimates vary widely, depending on the definitions of the deaths that are included in them. Estimates account for executions, deaths from man-made and intentional famines, as well as deaths that occurred during forced labordeportations, or imprisonment.

In addition to “mass killings,” terms that are used to define such killings include “democide“, “politicide“, “classicide“, and “genocide.”

(more…)
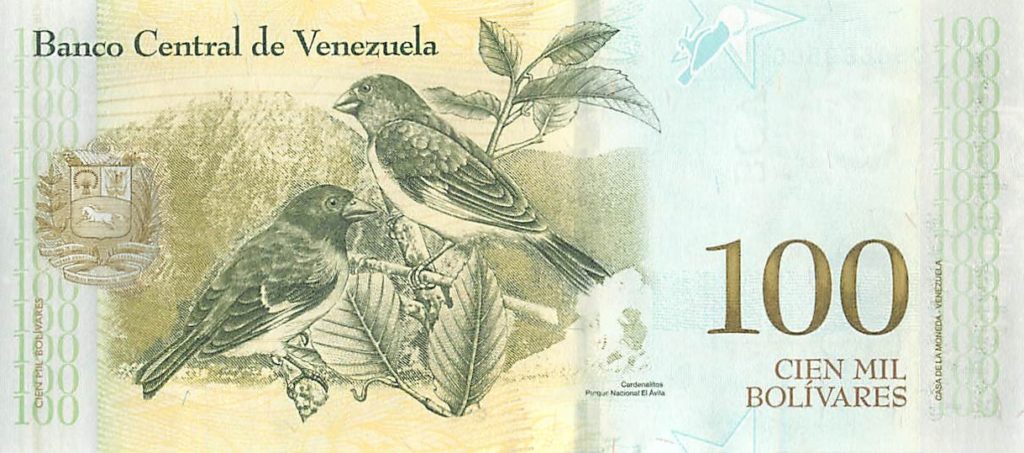
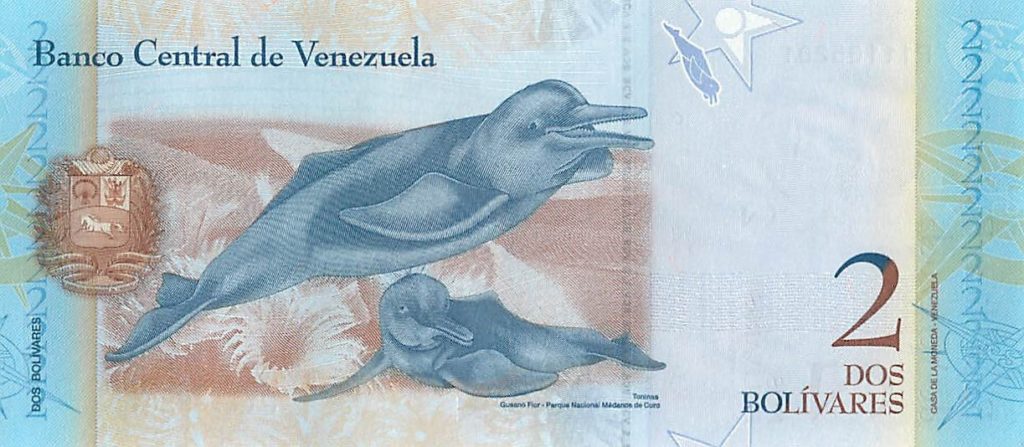
Back (reverse) of Venezuelan currency, 2007 – 2017

Reverse of 100,000 Bolivares paper currency. In 8/12 this would have been worth $10,000. In 9/15, only $125. By 12/17, it was worth $0.90. In 12/18, seven of these would have been worth a US penny.

Before we use Venezuelan Bolivares currency to show the devastation of hyperinflation, let’s finish looking at the currency.

Previous post showed the front (obverse) of 2 through 100,000 Bolivares paper money.

Now let’s look at the back (reverse).

The reverse side shows various wildlife.

2 – dated 12/27/12 – Toninas

5 – dated 5/24/07, Cachicama gigante, giant cachicamo

(more…)

Front of Venezuelan currency (obverse), 2007 – 2017

Reverse of 100,000 Bolivares paper currency. This is now worthless. In 12/20, one US dollar could get you 1.2 MILLION of these.

To illustrate the devastation from hyperinflation, we will now use Venezuelan Bolivares currency to see what it looks like in terms of paper currency.

To start, we will look at the currency itself.

As usual for currency outside the U.S., the paper money of Venezuela are esthetically beautiful. All the bills are colorful with lovely illustrations. All the ones we will now see have a nice sized watermark at the otherwise empty space. The watermarks are same face at the bottom of the obverse (front).

Portraits on the obverse of the currency are patriotic reminders of the struggle for Venezuelan independence.

To start our pictorial excursion, here are the obverses of the 2 Bolivar through 100,000 Bolivar currency:

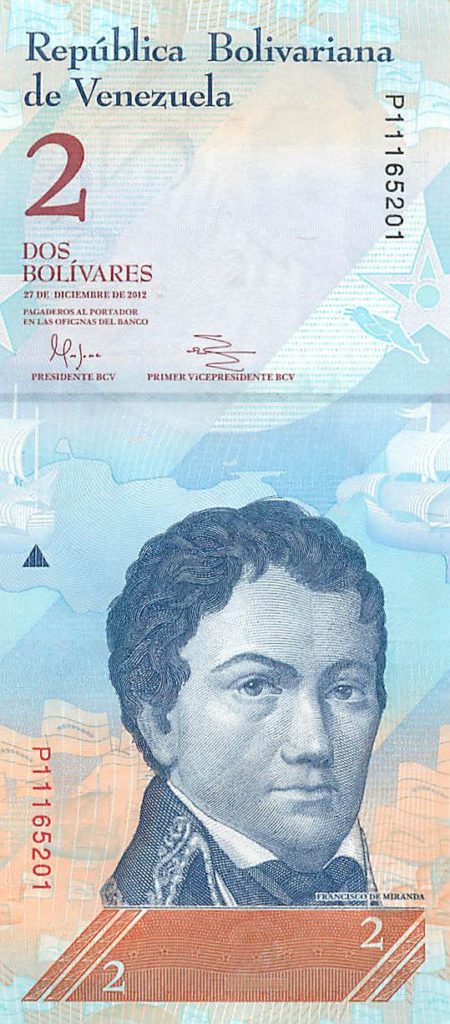
2 – dated 12/27/12, featuring Francisco de Miranda, his efforts for independence in South America failed; he served as forerunner of Simon Bolivar.

5 – dated 5/24/07, featuring Negro Primero

(more…)

This is hyperinflation, Venezuela edition. Expected devastation from socialism. Part 4.

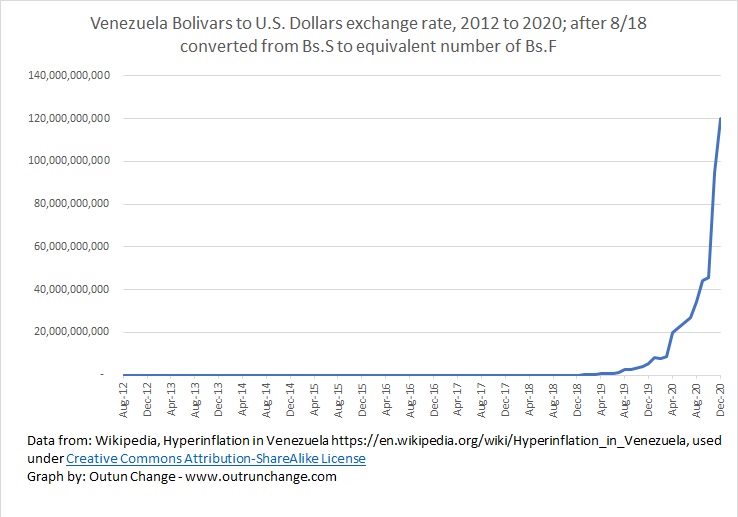
Final graph in this series of posts showing the devastating hyperinflation currently running loose in Venezuela will combine two sets of data.

Purpose of doing so is to see if the two sets of data overlap so that there is some good longer-term information that can be used into the future. The source for current data only goes back to late 2020.

Graph at the top of this post shows exchange rate of Venezuelan Bolivars into US dollars between June 2019 and March 2021. This graph is expressed in Bolivar soberanos (Bv.s).

(more…)

This is hyperinflation, Venezuela edition. Courtesy of socialism, of course. Part 3.

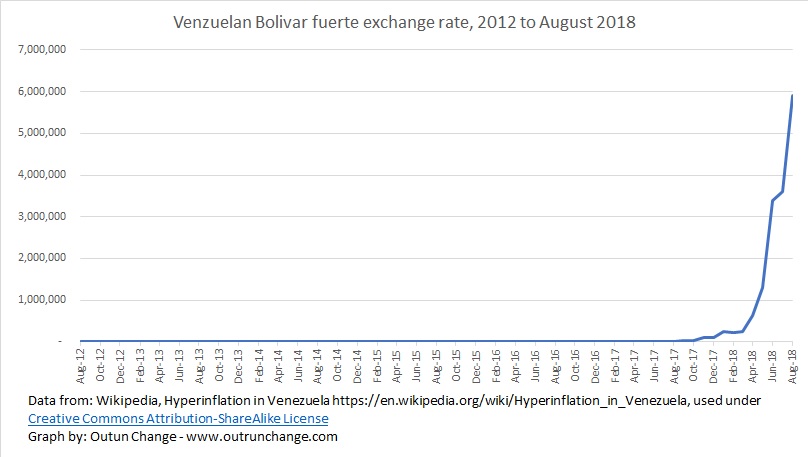
This image has an empty alt attribute; its file name is Venezuela-exchange-rate-2012-2018.jpg

Let’s look at the exchange rate in Venezuela in more detail, breaking out the exchange rate before and after 2018. On the previous graphs it looked like the exchange rate deterioration wasn’t that bad in the lead up to 2018 and it looks like things turned real bad starting in 2019.

That’s the weird thing about hyperinflation. If you remove the recent severe acceleration you still see the rapid increase earlier.

Graph at the top of this post shows exchange rate through 2018. It looks like hyperinflation kicked off in early 2018. Actually, it was going crazy before that. Inflation so severe as to destroy the economy has been running since 2012. Let’s change that graph above to a logarithmic scale to show the percentage changes better.

(more…)

This is hyperinflation, Venezuela edition. Courtesy of socialism, as always. Part 1.

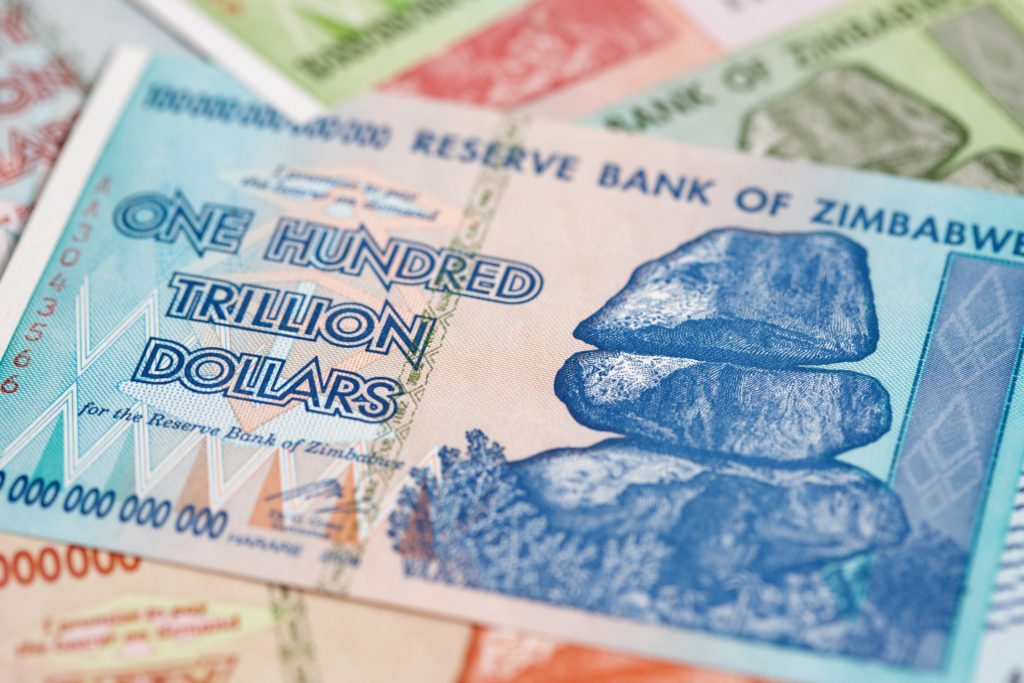
Banknotes of Zimbabwe after hyperinflation. Image courtesy of Adobe Stock.

Socialism in Venezuela has produced the expected results – poverty, a collapsing economy, and people fleeing for their lives. Twenty some odd years of socialism has also produced another foreseeable consequence – hyperinflation.

Let’s track the exchange rate of Venezuelan Bolivars to US dollar as an indicator.

According to Exchange-Rates.org, here is exchange rate of the Venezuelan bolivar to dollar from 9/11/20 through 3/5/21. Here is the month end data:

(more…)