Final graph in this series of posts showing the devastating hyperinflation currently running loose in Venezuela will combine two sets of data.
Purpose of doing so is to see if the two sets of data overlap so that there is some good longer-term information that can be used into the future. The source for current data only goes back to late 2020.
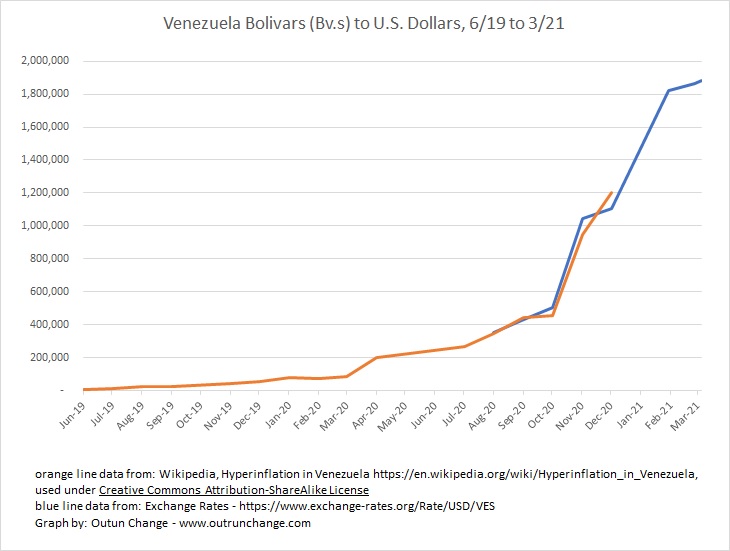
Graph at the top of this post shows exchange rate of Venezuelan Bolivars into US dollars between June 2019 and March 2021. This graph is expressed in Bolivar soberanos (Bv.s).
The two sets of data are from:
- Exchange-Rates.org – exchange rate of the Venezuelan bolivar to dollar from 9/11/20 through 3/5/21.
- Wikipedia article Hyperinflation in Venezuela.
The Wikipedia data is used under the Creative Commons Attribution-ShareAlike License which means I can use the information, modify it, adapt it, share it, or distribute it, even commercially if so desired. In turn that means the information in this blog post, but only this specific blog post, may be used by anyone under the Creative Commons Attribution-ShareAlike License.
The information on the orange line in these two graphs is from Exchange-Rates.org. The blue line data was obtained from the Wikipedia article.
The close overlap of the two sets of data from 9/20 through 12/20 shows strong continuity of the two sets of data. I will therefore use them together going into the future.
Graph above from 6/19 through 3/21 shows the same hockey-stick form that we have seen consistently. This is typical in a hyperinflation environment.
Let’s adjust that to logarithmic scale. As a reminder, log scale shows percentage changes.
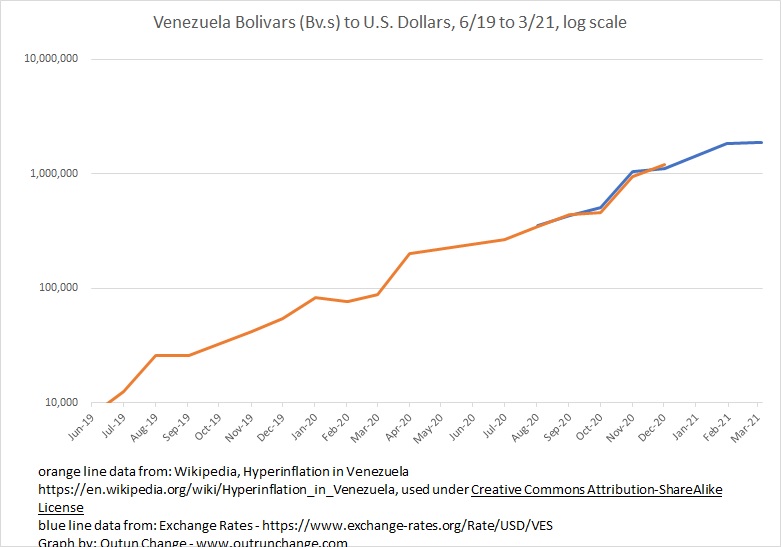
There are some wiggles in the line but it looks to be relatively straight. This means the inflation rate has been a roughly consistent percentage for the last 21 months or so.
To put these back into numbers, check out the exchange rate of how many Bv.s it takes to buy $1:
| Dec-18 | 730 |
| Jun-19 | 7,880 |
| Dec-19 | 54,702 |
| Jul-20 | 268,022 |
| Dec-20 | 1,105,830 |
| Mar-21 | 1,879,751 |
That is a devastating deterioration in the exchange rate which means in a devastating inflation rate. From 700 at the end of one year, to 54,000 the next year, to 1,100,000 at end of the following year. Up to 1,900,000 three months later.
That, my dear readers, is socialism for you.
See also:
0 Comments