Hyperinflation is running rampant in Venezuela. Previous post described the deteriorating exchange rate in 2020 and thus far in 2021.
Let’s take a longer-term view to see the devastation of hyperinflation over the course of several years. We will turn to data available from Wikipedia in the article Hyperinflation in Venezuela.
The data in the following table is used under the Creative Commons Attribution-ShareAlike License. This means I can use the information, modify it, adapt it, share it, or distribute it, even commercially if so desired.
The requirement of doing so is that anything created from this data must be shared with others under the same license.
So, the information in this blog post, but only this specific blog post, may be used by anyone under the Creative Commons Attribution-ShareAlike License.
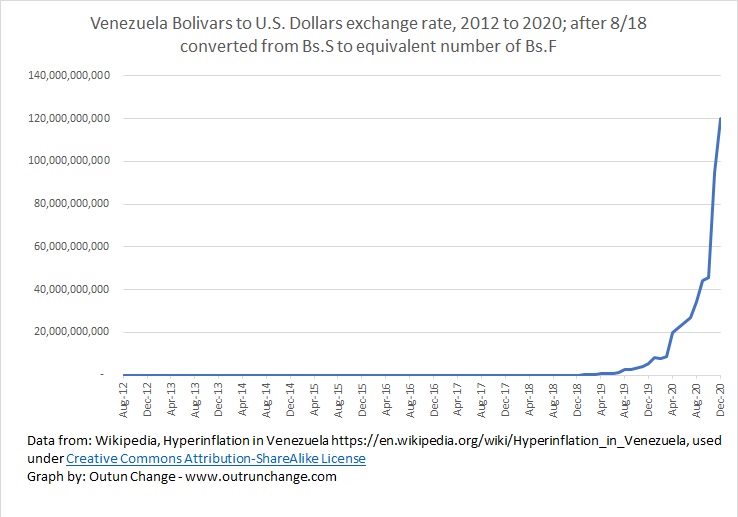
Graph at the top of this post shows the exchange rate over time. The raw data is at the bottom of this post.
A few comments are necessary on the exchange rates listed in this series.
The exchange rates from August 2012 through August 2018 are in Bolivar fuerte (Bs.F) to the US dollar. A reevaluation in 2018 substituted 100,000 of the old currency for one of the new currency. This essentially lopped five digits off all currency.
From August 2018 through December 2020 the table lists exchange rates of Bolivar soberano (Bs.S) to the US dollar times 100,000. This keeps the unit numbers of Bs.S. and Bs.F consistent.
Oh, the Bolivar fuerte (Bs.F) was adjusted so that it equaled 1000 Bolivars (Bs.). Here are the cumulative conversion ratios:
- 1 Bs.F = 1,000 Bs.
- 1 Bs.S = 100,000 Bs.F = 100,000,000 Bs.
If you look at the graph above, it appears horizontal until sometime in 2019, at which point it turns a corner rapidly and then in 2020 it seems to go straight up. It is hard to make sense of that kind of a radical graph.
As a mentioned in the previous post, to make sense of that kind out of control hyperinflation, we need to transition the graphs into a logarithmic scale. We usually draw graphs so that every line is an arithmetic increase. Going from 1, to 2, to 3, and so forth. On a logarithmic scale every line is an increase by a factor of 10. On a log scale the lines would be 10, then 100, then 1,000, then 10,000, then 100,000. What this does is allow you to see trends on a percentage basis.
Something that is increasing by factor of 10 over time would look like a straight line on a log scale. On a more typical arithmetic scale it would be horizontal with a slight increase, then turns a corner, and then seems to go straight up.
Now let’s look at that accelerating exchange rate on a log scale:
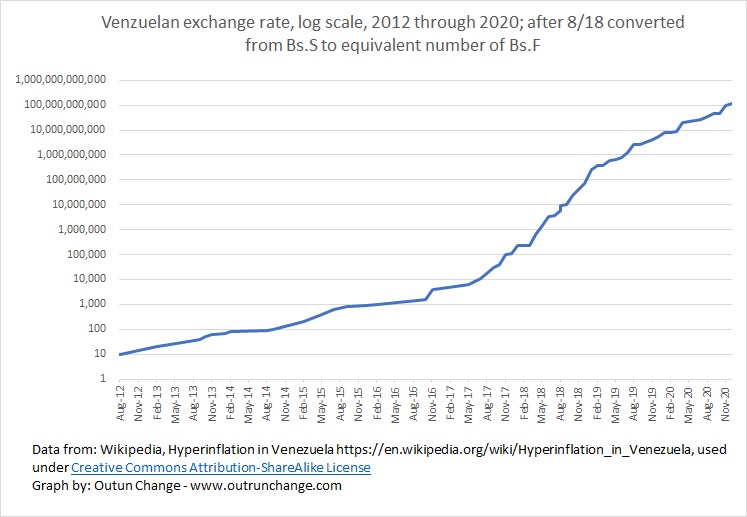
What previously appeared to be a flatline through 2018 is actually showing significant inflation from 2012 through 2016, but at a fairly stable rate.
The rate of an inflation accelerated more starting in late 2016 and continued through late 2018. At that point the hyperinflation slowed a little bit.
By little I mean in the course of about two years going from around 73M Bs.F equivalents in 12/18 to 5,470M equivalent Bs.F in 12/19 before ending at 120,000M Bs.F equivalents in 12/20.
As previously mentioned, the information in this blog post, but only this specific blog post, may be used by anyone under the Creative Commons Attribution-ShareAlike License.
Raw data from the Wikipedia article, with Bs.S adjusted to equivalent number of Bs.F:
| date | Bs.F equivalent |
| Aug-12 | 10 |
| Feb-13 | 20 |
| Jun-13 | 30 |
| Sep-13 | 40 |
| Oct-13 | 50 |
| Nov-13 | 60 |
| Jan-14 | 70 |
| Feb-14 | 80 |
| Aug-14 | 90 |
| Sep-14 | 100 |
| Feb-15 | 200 |
| May-15 | 400 |
| Jul-15 | 600 |
| Sep-15 | 800 |
| Dec-15 | 900 |
| Feb-16 | 1,000 |
| Oct-16 | 1,500 |
| Nov-16 | 4,000 |
| May-17 | 6,000 |
| Jun-17 | 8,000 |
| Jul-17 | 11,000 |
| Aug-17 | 18,000 |
| Sep-17 | 29,000 |
| Oct-17 | 41,000 |
| Nov-17 | 97,000 |
| Dec-17 | 111,000 |
| Jan-18 | 236,000 |
| Feb-18 | 228,000 |
| Mar-18 | 236,000 |
| Apr-18 | 621,000 |
| May-18 | 1,300,000 |
| Jun-18 | 3,400,000 |
| Jul-18 | 3,600,000 |
| Aug-18 | 5,900,000 |
| Aug-18 | 9,000,000 |
| Sep-18 | 10,000,000 |
| Oct-18 | 24,000,000 |
| Nov-18 | 41,000,000 |
| Dec-18 | 73,000,000 |
| Jan-19 | 272,000,000 |
| Feb-19 | 370,000,000 |
| Mar-19 | 372,000,000 |
| Apr-19 | 612,000,000 |
| May-19 | 635,000,000 |
| Jun-19 | 788,000,000 |
| Jul-19 | 1,252,000,000 |
| Aug-19 | 2,595,000,000 |
| Sep-19 | 2,600,000,000 |
| Nov-19 | 4,170,000,000 |
| Dec-19 | 5,470,200,000 |
| Jan-20 | 8,327,300,000 |
| Feb-20 | 7,714,200,000 |
| Mar-20 | 8,739,600,000 |
| Apr-20 | 20,005,800,000 |
| Jul-20 | 26,802,200,000 |
| Aug-20 | 34,512,300,000 |
| Sep-20 | 44,482,300,000 |
| Oct-20 | 45,803,200,000 |
| Nov-20 | 95,000,000,000 |
| Dec-20 | 120,000,000,000 |
See also:
0 Comments