Rap video from a few years ago showing the failed arguments for Keynesian economics and the consequences of messing around with the money supply and artificially forcing interest rates low. Pushing down interest rates leads to mal-investment in projects that are not really good plans. When interest rates eventually rise, Read more
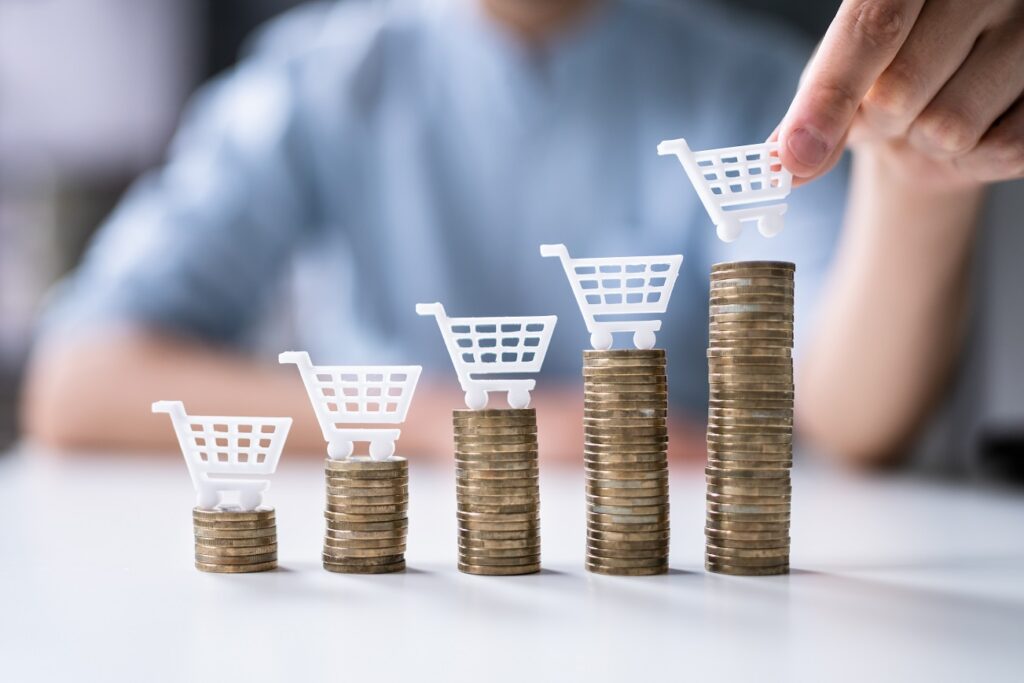
The size of a bite which inflation is taking out of every meal is accelerating for those of us who are not living at the top of an ivory tower fortress inside the D.C. Beltway.
Got lunch from Jimmy John’s yesterday. They fix up yummy sandwiches.
I had turkey on French bread with provolone cheese. Split a large sandwich with my dining partner. ‘Twas delish’.
Price was $14.99. Yeah fifteen bucks for just the sandwich, to go, so nothing for the greedy state tax machine.
Last August the exact same sandwich was $12.99. Up an even $2.00.
For another data point of inflation experienced by consumers, let’s consider the holiday meal at a restaurant here in Rancho Cucamonga. Consider the contrast with the official CPI measurements.
This is third discussion on the same-meal-at-the-same-restaurant price index.
One of the nicer restaurants (perhaps nicer is only on my scale) in our area is called Mimi’s. They offer a limited selection of meals on holidays which are nicer than their usual entrée. Today two of the five main choices were either ham or turkey with identical side dishes of mashed potatoes, cornbread dressing, green beans, choice of three appetizers, and choice of three desserts.
On Thanksgiving Day 2021 the meal cost was $25. On Easter day 2022 the meal cost was $28.
Today we celebrate the most important day in the history of the world. Easter. We remember the resurrection of Jesus Christ from the dead. On the preceding Friday, he was brutally executed by the Roman government at the insistence of the religious leaders. His sacrifice on the cross paid the Read more
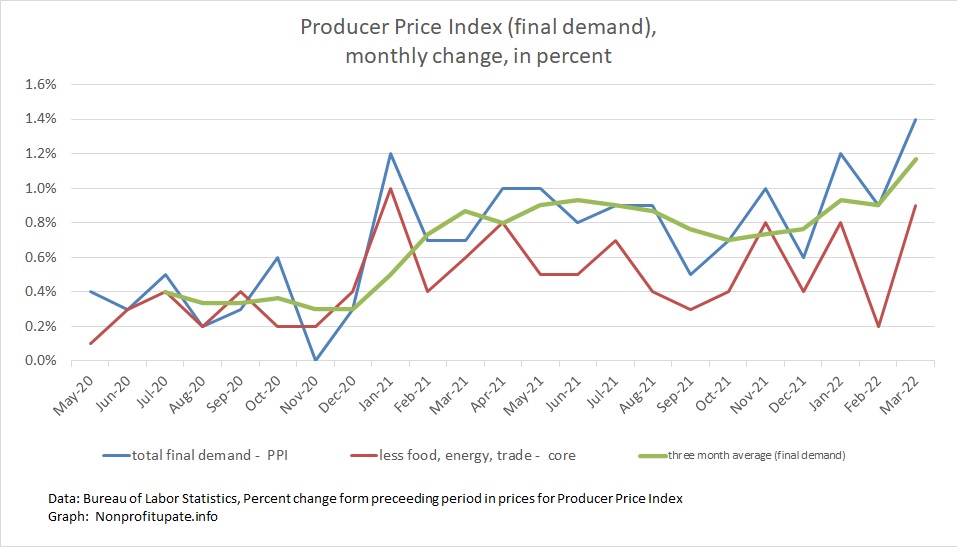
The Producer Price Index (PPI) rose 1.4% in March 2022. This follows the February increase revised up by 0.1% to 0.9%. The January increase was previously revised up by 0.2% to 1.2%.
That is 3.5% in the first quarter of 2022.
The increases are driven by strong consumer demand and constrained supply.
Powerful demand is compounded by trillions of dollars having been flooded into the economy. On the supply side, ongoing supply chain problems are compounded by things like shutting down Shanghai, a city of 27 million which takes off line all their production and stops shipping from a major port. Further restricting the supply side are also soaring energy prices due to U.S. federal policies and the war in Ukraine.
Keep in mind the prior month changes in PPI are revised as needed. This is in contrast to CPI, which is not revised.
This shows there are plenty of increases in wholesale prices, which means there is a lot of inflation heading our way because that is what producers and providers are experiencing. Those increases will hit us consumers soon.
Graph at the top of this post shows the monthly price change for total demand, final demand core (which excludes food, energy, and trade), along with three month average of the final demand.
With revisions, the year over year increase in PPI for recent months is:
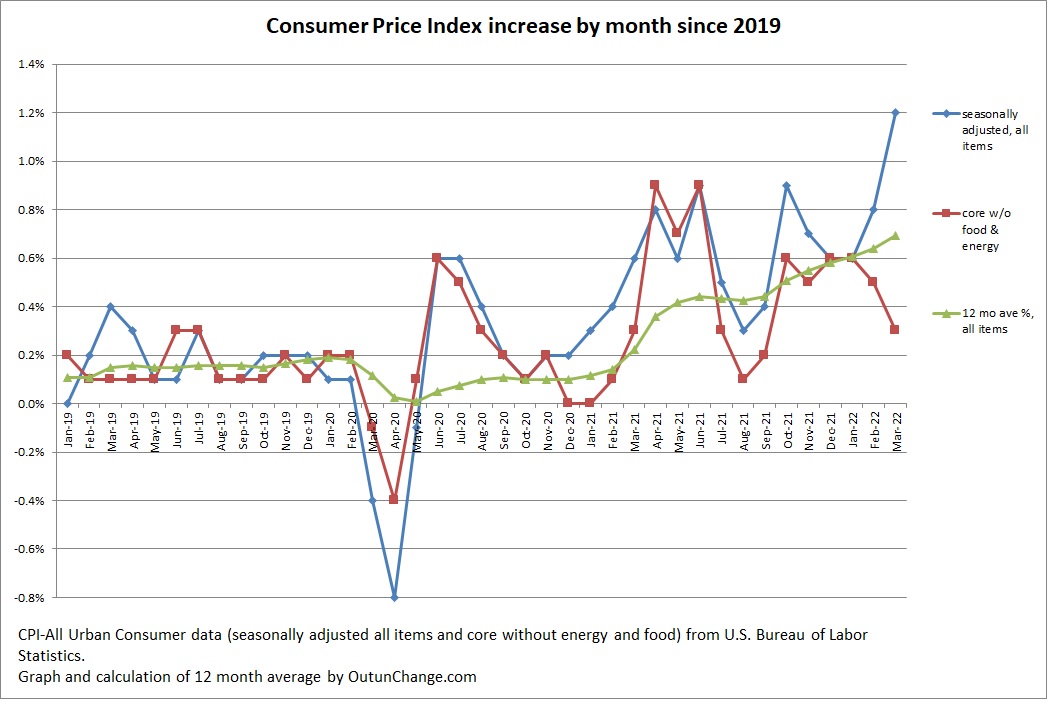
The Consumer Price Index (CPI) increased a staggering 1.2% in March 2022 after 0.8% in February
That is 2.6% for the last three months. Project three months out to a full year would be 10.4%
Graph at top of this post shows the monthly increase in the all-items index along with the core change, which excludes food and energy. Graph also shows an average of the preceding 12 months for the all-items indicator.
By the way, with the CPI accelerating the top number in all of these graphs had to be increased. That is the result of high inflation that is accelerating,
The 12 month cumulative change continues to skyrocket. The monthly change in all items index and the cumulative change for 12 months looks as follows:
Introducing the fried-chicken-meal inflation index.
Previous discussions on this blog have featured the consumer price index measuring prices paid by urban consumers, the producer price index measuring input prices paid by manufacturers and producers, along with the personal consumption expenditure index, which is the favorite measure of inflation at the Federal Reserve Bank.
Now we have the fried-chicken-index.
This newest inflation measure is based on the price charged in Rancho Cucamonga, California (including tax) for a three-piece chicken tenders meal with one side, biscuit, and medium soda as prepared by the Colonel from Kentucky.
According to this index, the price of the meal went up 4.7% in the first quarter of 2022.
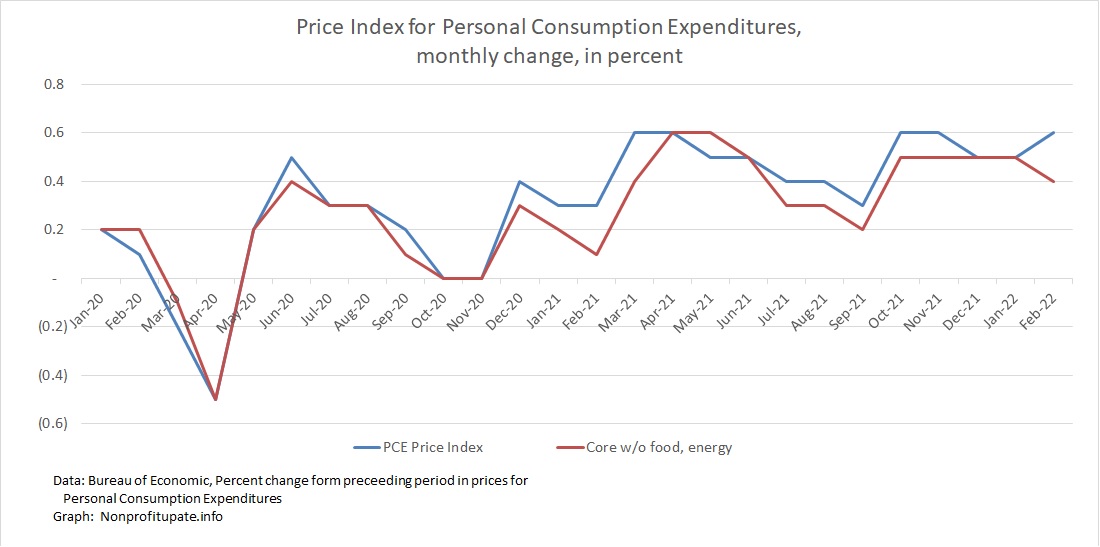
Rising PCE price index is sitting at the highest level since 1982, which is 40 years ago.
Unless you are in your 60s or older, you have little memory of inflation at this severe a level. If this sustains for a few more years, the impact will be brutal.
Personal Consumption Expenditure (PCE) inflation index increased 0.6%, which follows 0.5% in January 2022 which was revised downward from 0.6%.
The core PCE inflation rate (without food and energy) was 0.4% in February, following 0.5% rise in January, matching the 0.5% increase for the previous three months. The October 2021 increase was revised up 0.1%.