This is hyperinflation, Venezuela edition. Courtesy of socialism, of course. Part 3.

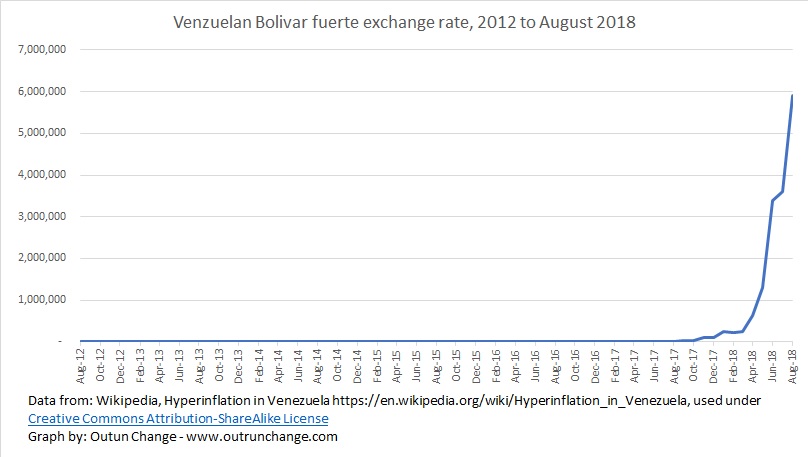
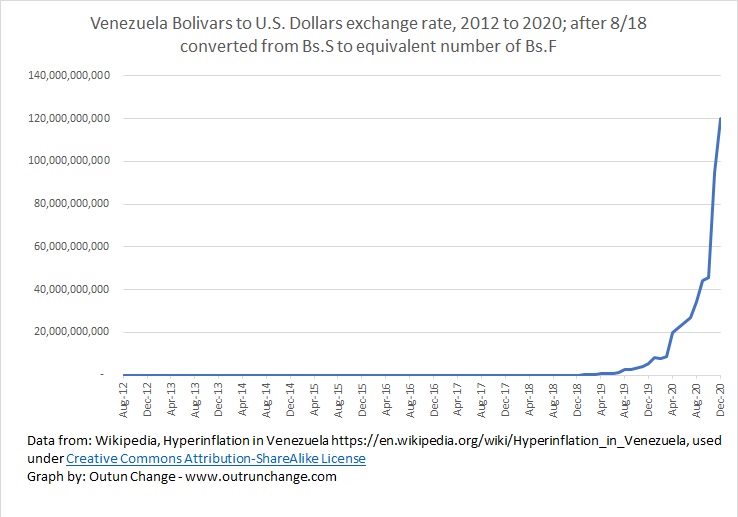
Let’s look at the exchange rate in Venezuela in more detail, breaking out the exchange rate before and after 2018. On the previous graphs it looked like the exchange rate deterioration wasn’t that bad in the lead up to 2018 and it looks like things turned real bad starting in 2019.
That’s the weird thing about hyperinflation. If you remove the recent severe acceleration you still see the rapid increase earlier.
Graph at the top of this post shows exchange rate through 2018. It looks like hyperinflation kicked off in early 2018. Actually, it was going crazy before that. Inflation so severe as to destroy the economy has been running since 2012. Let’s change that graph above to a logarithmic scale to show the percentage changes better.
(more…)


