Research shows no identifiable benefit from wearing masks.

Image courtesy of Adobe Stock.

There is a surge of articles denouncing pandemic policy along with emerging research showing the destruction caused by intentional government policy.

I have made note of many of these articles and hope to start discussing them.

In this post:

  • Metastudy of 78 randomized control experiments finds masks have no benefit.
  • Pro-mask is anti-science. Anti-mask is pro-science. (Pro-mask is actually a religion.)

Our political, public health, educational, and religious leaders have much to answer for.

2/10/23 – The Spectator – I’m pro science. That’s why I’m anti-mask – The former brand president at Levi Strauss was hounded out of her job because she had the audacity to ask, in a company that presumably doesn’t actually hire any toddlers, whether a mandatory mask for toddlers was harmful.

She was accused of being “anti-science.” Oh the horror! Off with her head!!

Research from the Cochran study, which will be discussed more later, analyzed 78 studies covering 1 million people. The conclusion?

(more…)

About that 95% effective vaccine… (part 1)


Image courtesy of Adobe Stock.

The Covid vaccination is 95% effective against infection.

That is what we were told by every public health official and media outlet in order to persuade us to get the shots.

95%.

It has been so effective we should get a booster. And another booster. And now there is a brand new fifth booster, because the previous four worked so well.

This is the first in a series of posts explaining the effectiveness statements were not only false, but were known to be false at the time.

We start with a survey of how incredibly effective the vaccine has been in 2022:

CDC director

10/31/22 – Center for Disease Control – Update on CDC Director and COVID-19 – I cannot describe this more lastingly than merely quoting the straight line offered by the CDC press release:

(more…)

15% increase in 8 months. Another entry for the Same-Meal-at-the-Same-Restaurant price index.

Image courtesy of Adobe Stock.

The size of a bite which inflation is taking out of every meal is accelerating for those of us who are not living at the top of an ivory tower fortress inside the D.C. Beltway.

Got lunch from Jimmy John’s yesterday. They fix up yummy sandwiches. 

I had turkey on French bread with provolone cheese. Split a large sandwich with my dining partner.  ‘Twas delish’.

Price was $14.99.  Yeah fifteen bucks for just the sandwich, to go, so nothing for the greedy state tax machine.

Last August the exact same sandwich was $12.99. Up an even $2.00.

(more…)

Same-Meal-at-the-Same-Restaurant price index increases 12% in 5 months. Oh, and a less tasty meal.

Image courtesy of Adobe Stock.

For another data point of inflation experienced by consumers, let’s consider the holiday meal at a restaurant here in Rancho Cucamonga.  Consider the contrast with the official CPI measurements.

This is third discussion on the same-meal-at-the-same-restaurant price index.

One of the nicer restaurants (perhaps nicer is only on my scale) in our area is called Mimi’s. They offer a limited selection of meals on holidays which are nicer than their usual entrée. Today two of the five main choices were either ham or turkey with identical side dishes of mashed potatoes, cornbread dressing, green beans, choice of three appetizers, and choice of three desserts.

On Thanksgiving Day 2021 the meal cost was $25. On Easter day 2022 the meal cost was $28.

That is a $3 increase.

(more…)

Increases in Producer Price Index continue at high rate and continue rising. Up 1.4% in March 2022.

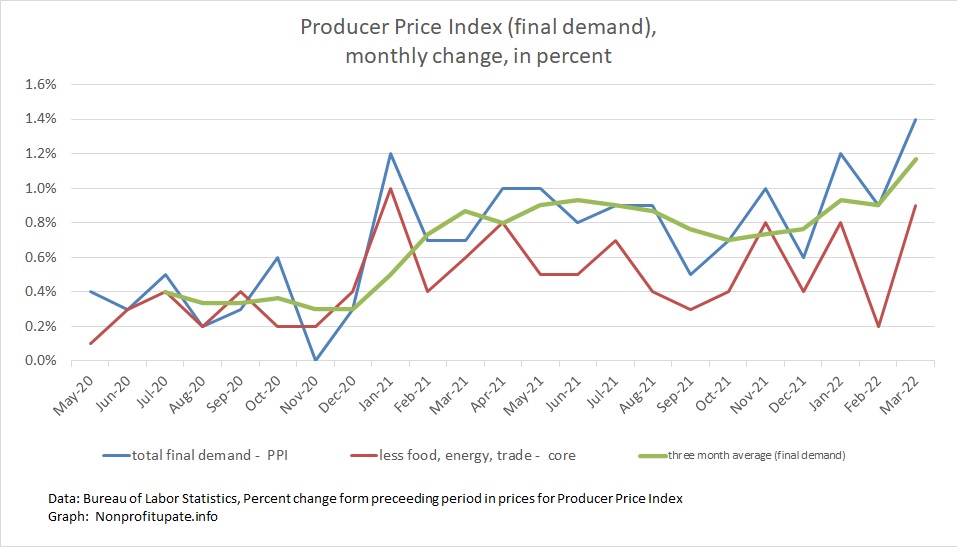
The Producer Price Index (PPI) rose 1.4% in March 2022. This follows the February increase revised up by 0.1% to 0.9%. The January increase was previously revised up by 0.2% to 1.2%.

That is 3.5% in the first quarter of 2022.

The increases are driven by strong consumer demand and constrained supply.

Powerful demand is compounded by trillions of dollars having been flooded into the economy. On the supply side, ongoing supply chain problems are compounded by things like shutting down Shanghai, a city of 27 million which takes off line all their production and stops shipping from a major port. Further restricting the supply side are also soaring energy prices due to U.S. federal policies and the war in Ukraine.

Keep in mind the prior month changes in PPI are revised as needed. This is in contrast to CPI, which is not revised.

This shows there are plenty of increases in wholesale prices, which means there is a lot of inflation heading our way because that is what producers and providers are experiencing. Those increases will hit us consumers soon.

Graph at the top of this post shows the monthly price change for total demand, final demand core (which excludes food, energy, and trade), along with three month average of the final demand.

With revisions, the year over year increase in PPI for recent months is:

(more…)

Consumer Price Index shows massive 1.2% increase in March. One year increase rises to 8.5%.

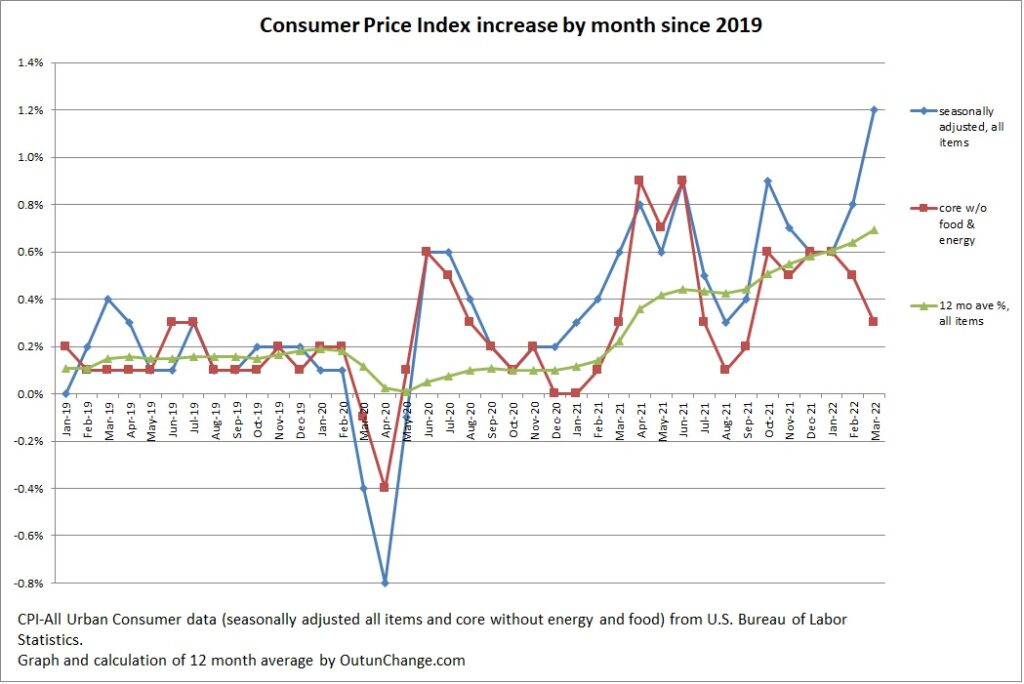
The Consumer Price Index (CPI) increased a staggering 1.2% in March 2022 after 0.8% in February

That is 2.6% for the last three months. Project three months out to a full year would be 10.4%

Graph at top of this post shows the monthly increase in the all-items index along with the core change, which excludes food and energy. Graph also shows an average of the preceding 12 months for the all-items indicator.

By the way, with the CPI accelerating the top number in all of these graphs had to be increased.  That is the result of high inflation that is accelerating,

The 12 month cumulative change continues to skyrocket. The monthly change in all items index and the cumulative change for 12 months looks as follows:

(more…)