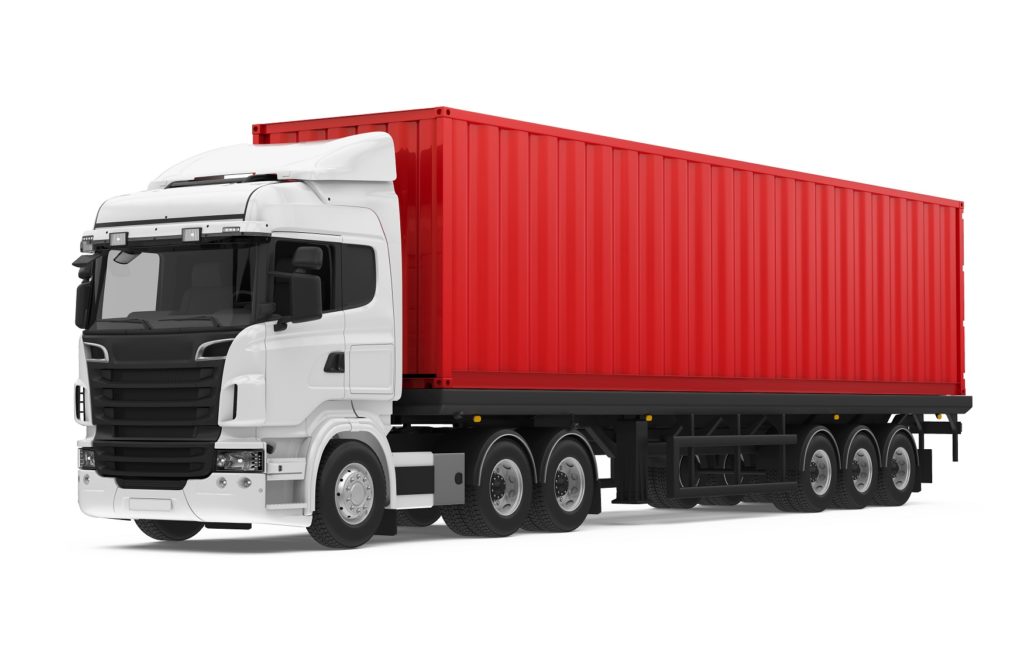
Cargo container on chassis pulled by big rig truck. Image courtesy of Adobe Stock.
String of articles are pointing at disruptions in the supply chain continuing well into 2022 or possibly 2023.
A few of said articles discussed below:
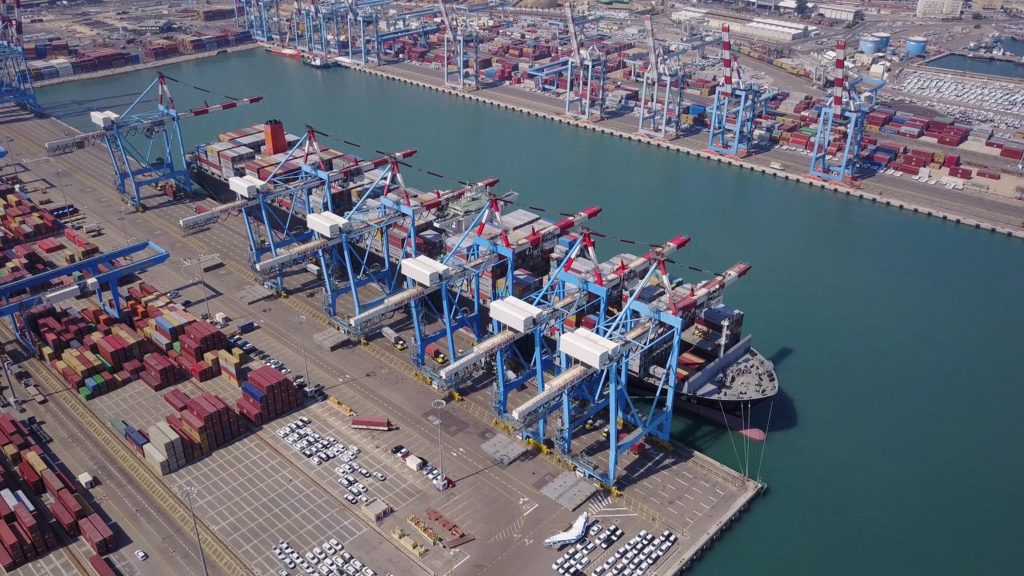
Tally of ships off the Long Beach and Los Angeles ports rises to record of 111.
Experienced truck driver describes how every step of the trucking part of the supply chain is tangled up, from extra wait getting into the port all the way to several hours waiting to drop cargo at warehouses.
Disruption of chip supply expected to last until sometime in 2023.
Do please keep in mind this is due to the hubris of government officials thinking an economy can be turned off and on light a light switch and also flooding the economy with several trillion dollars without any corresponding increase in output.
Washington Free Beacon – 11/10/21 – Record Number of Ships Stranded Outside California Ports – Article sites Business Insider as saying there are 111 ships waiting to unload at Los Angeles and Long Beach ports as of 11/9/21. This backlog is new high from previous record of 108 ships on 10/21/21.
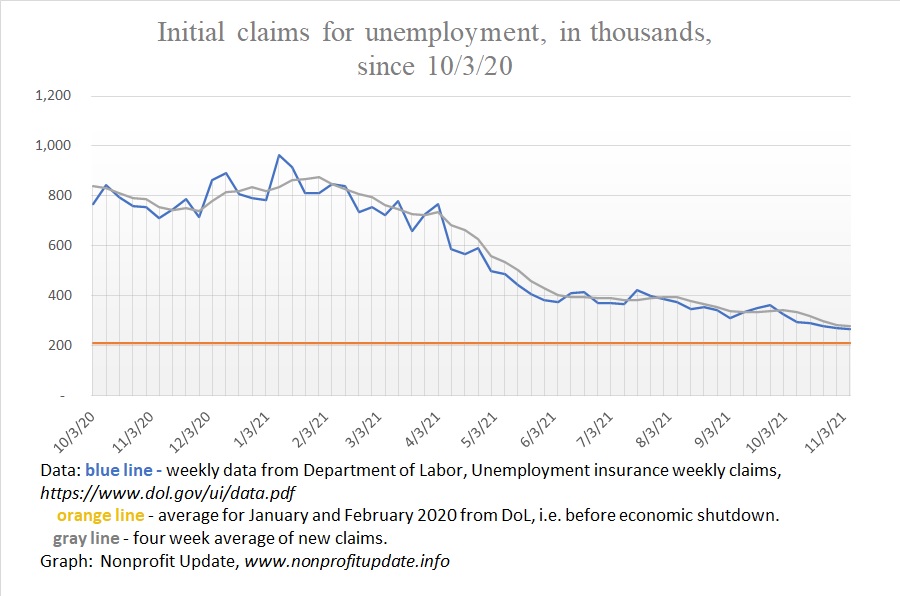
The number of new claims for unemployment is slowly declining.
For the week ending 11/6/21 there were 267,000 new claims. While this is encouraging progress, keep in mind the number of people who are getting laid off is still far above the average of 212,000 per week all the way back in January and February 2020. We are still seeing more people laid off every week than before the pandemic began.
(Posts on my other blogs discussing the unemployment situation are going to be cross-posted to this blog. Intentional federal policies are a drag on the employment situation and thus need to be discussed here as a drag on our economic freedom.)
Here is a recap of newly unemployed over the last several months:
Got to wondering how much money the Fed has created out of thin air and then pumped into the economy. The answer is a vague “bunches and bunches.”
How do I know that? Because of my reading over the last few years. I pay attention to such stories (yeah, yeah, I know – I’m weird – pray for me as you feel led). I also am aware the Fed pumped a lot of money into the economy when the pandemic started.
There have been lots of news reports commenting they have been pumping something in the range of $100 billion a month into the economy after their initial round.
As I was thinking about things the federal, state, and local government have been doing to harm the economy, got to wondering just exactly how much fiat money the Fed has been creating, out of thin air of course. Yeah, I wonder about such things.
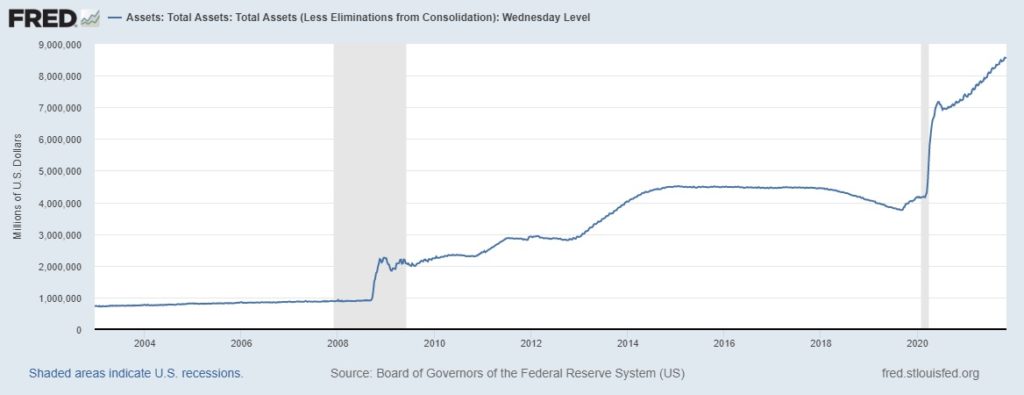
Answer is again bunches and bunches, and is measured in trillions of dollars.
Graph above shows the amount of total assets on the Federal Reserves balance sheet since around 2003.
This is start of what will be a series of posts describing steps taken by federal, state, and local officials to compound the supply chain problem we are experiencing. Other policies, deliberately imposed, have the foreseeable consequence of being a drag on the economy. There are lots of recent articles pointing out policies, intentional policies by supposedly intelligent bureaucrats, which have the effect of making it more difficult to get things done.
A few policies that come to mind:
Tax on every container not pulled by a zero-emission truck.
Only a fraction of the trucks in the country allowed to pick up a container in California.
Owner/operators not allowed at the ports.
Fines on shipping companies who can’t get their containers out of the port because of congestion in the supply chain.
Additional tax on non-zero-emission trucks picking up cargo
Port Technology – 11/5/21 – Port of Los Angeles accelerates zero-emissions truck efforts – The Los Angeles Board of Harbor Commissions approved a requirement for trucks picking up cargo at either Long Beach or Los Angeles ports to be zero emission starting 4/1/22. Or else.
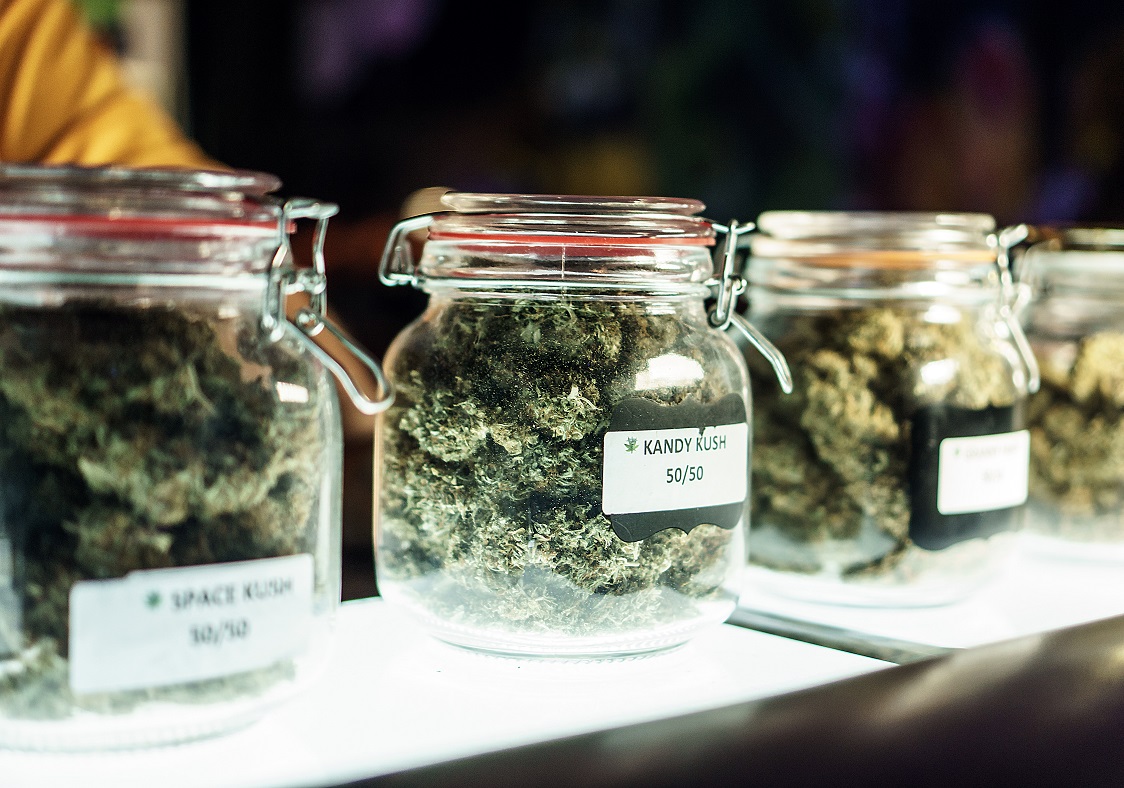
In what is an absolute lack of surprise to anyone who’s thought about the issue, the severe regulations imposed by the state of California on legal marijuana shops means the majority of marijuana sales take place in the black market.
After five years of legal recreational marijuana, sales in the illegal market are estimated to be twice the volume in legal stores.
This is the 32nd article I have written covering the legalized recreational marijuana market. You can see my other articles by clicking on the regulation experiment tag.
(Cross-post from my other blog Outrun Change. A bit of background – I’ve had a long running series of posts there describing the California efforts to legalize recreational use of marijuana as a natural experiment. In other words, let’s sit back and watch what happens in a brand new industry when the government implements severe, extensive regulations on a new industry and imposes harsh taxation on the industry’s product. Also, there is an existing illegal industry that provides a rough frame of reference of what the industry kinda’, sorta’ looks like. My prediction all along has been growth in the new industry would be artificially restricted from what would otherwise happen without the severe regulations. Looks like my predictions is correct. I will continue to watch this natural experiment.)
One way to measure how severely the legal marijuana business has been restricted is to look at the number of licensed marijuana shops per 100,000 residents. For six Western states that allow recreational sales, here is the number of legal dispensaries per 100,000 people:
The supply chain for so many of the things we buy is messed up at every step of the logistics system. Former CEO of Walmart pointed out the steps in the supply chain that are tangled up:
Loading ships at ports in Asia.
Ships are stuck in the water waiting to unload.
Unloading at ports in the US is another chokepoint.
There are not enough truck drivers.
Not enough labor and the various points in the distribution system inside the United States.
Shortage of people to put stuff on the shelves.
Essentially every stage of the distribution channel is tangled up. Biggest thing that could be done to get things moving normally would be more people to work at every step of the distribution system. Labor shortages, in other words.
This post discusses two articles:
California has imposed restrictions on trucking which has drastically reduced the number of trucks which can be operated in the state.
One article provides us a survey of a dozen other articles, each of which describes a different aspect of the supply chain disaster.
(Cross-post from Outrun Change. This rate of inflation is corrosive, slowly eating away economic freedom.)
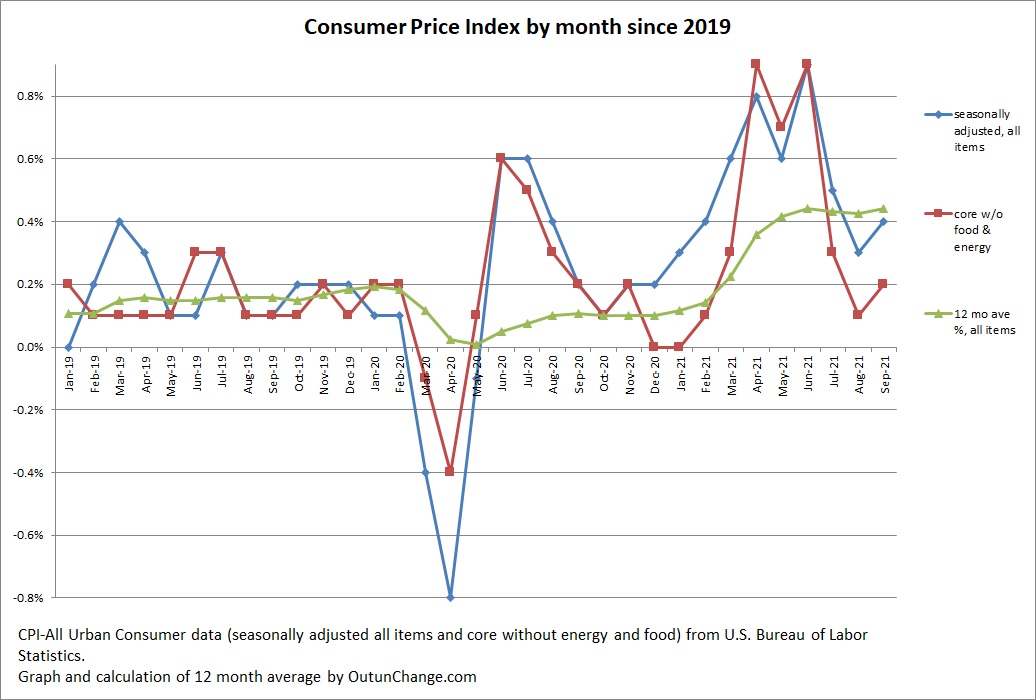
The Consumer Price Index, or CPI, shows a 0.4% increase in September 2021 for all-items with a core increase of 0.2%.
The rate of inflation for the last 12 months is 5.43% for all items and 3.86% for core inflation without food and energy.
Graph at top of this post shows the monthly increase in the all-items index along with the core change. Graph also shows an average of the preceding 12 months for all items.
Watch the green line increase from around 0.1% up to over 0.4% for the last five months.
The trailing 12 month average is also grim. It shows:
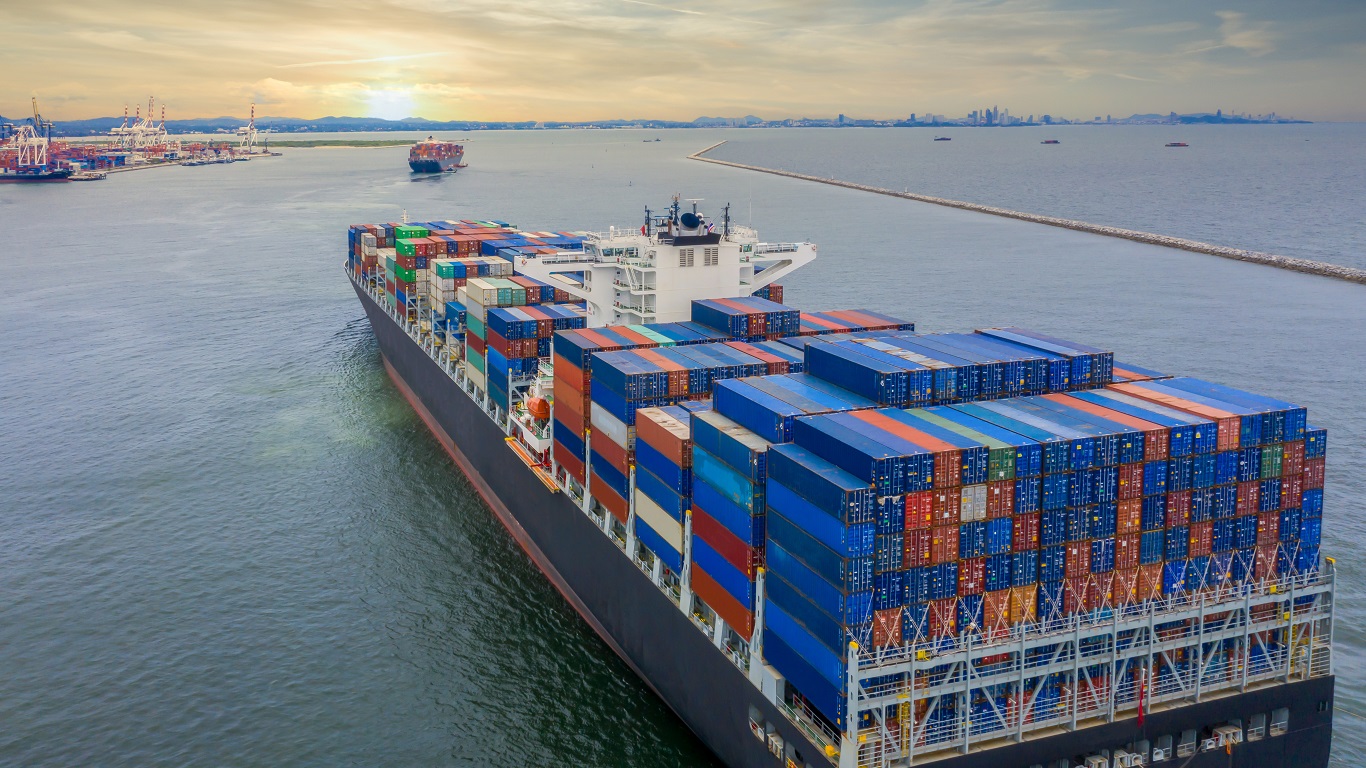
Rising costs and constrained shipping capacity is driving inflation and disrupting supply chain across the economy. Image courtesy of Adobe Stock.
Indicators I can see suggest inflation is going to continue at a high rate for quite some time. Here are a few of the articles I have read recently pointing towards ongoing rise in prices:
Rent component of CPI will increase substantially over the next year because of the way the index is calculated.
Shipping costs have already skyrocketed.
Multiple food producers are struggling with rapidly increasing costs.
Major food producer expects their costs go up 11% in the next year with prices they charge to go up by 4%.
The phrase “stagflation” is back in play. Oh joy, a possible (likely?) return to the Carter administration.
A friend of mine priced the apartment they are living in to help a relative who was moving into the area. Price for this exact unit is 50% more than when they signed their annual lease a number of months ago.
An acquaintance reports the price for renting a particular house went up while they were thinking about it for a day or so.
Two friends report landlords renting apartments expect six months rent in advance and some landlords renting houses are expecting a year in advance. A year.
Article mentioned above says the reports floating around in the media indicate rent hikes overall are around 10%. Yet the CPI shows only 2% increase in rent.
How can that be?
Fascinating detail of how the CPI is calculated explains the anomaly and also points towards dramatic increase in the rent component of CPI over the next year.