Reverse of 100,000 Bolivares paper currency. In 8/12 this would have been worth $10,000. In 9/15, only $125. By 12/17, it was worth $0.90. In 12/18, seven of these would have been worth a US penny.
Before we use Venezuelan Bolivares currency to show the devastation of hyperinflation, let’s finish looking at the currency.
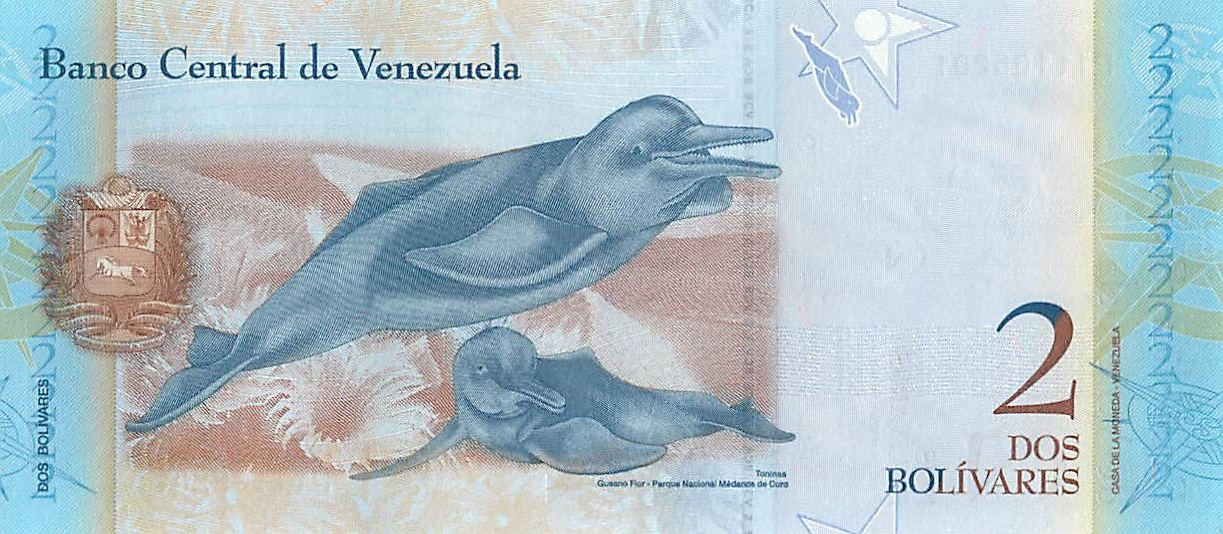
Previous post showed the front (obverse) of 2 through 100,000 Bolivares paper money.
Reverse of 100,000 Bolivares paper currency. This is now worthless. In 12/20, one US dollar could get you 1.2 MILLION of these.
To illustrate the devastation from hyperinflation, we will now use Venezuelan Bolivares currency to see what it looks like in terms of paper currency.
To start, we will look at the currency itself.
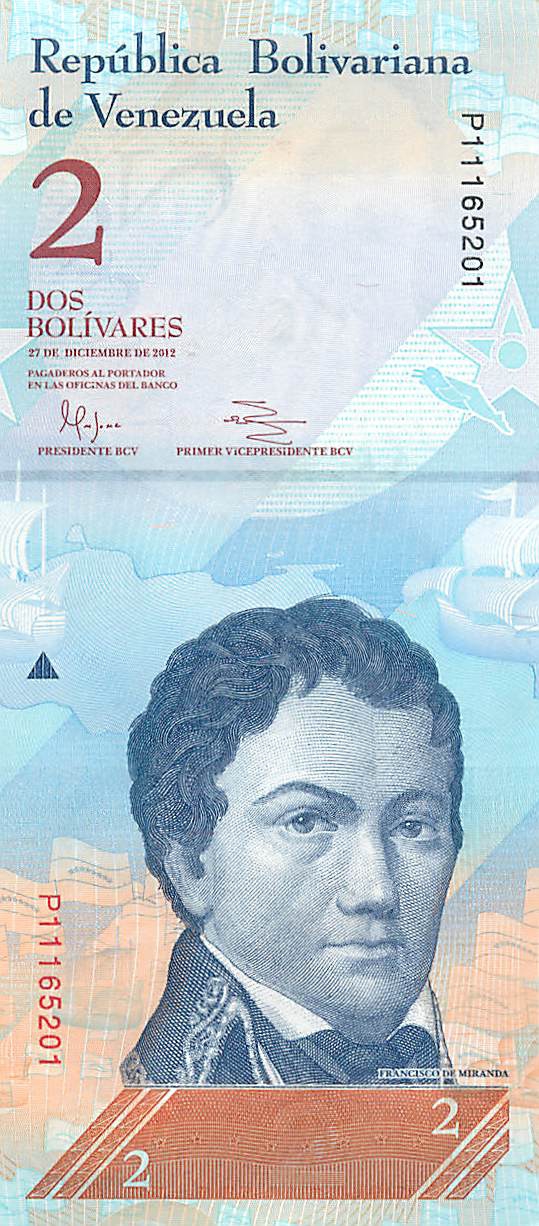
As usual for currency outside the U.S., the paper money of Venezuela are esthetically beautiful. All the bills are colorful with lovely illustrations. All the ones we will now see have a nice sized watermark at the otherwise empty space. The watermarks are same face at the bottom of the obverse (front).
Portraits on the obverse of the currency are patriotic reminders of the struggle for Venezuelan independence.
To start our pictorial excursion, here are the obverses of the 2 Bolivar through 100,000 Bolivar currency:
2 – dated 12/27/12, featuring Francisco de Miranda, his efforts for independence in South America failed; he served as forerunner of Simon Bolivar.
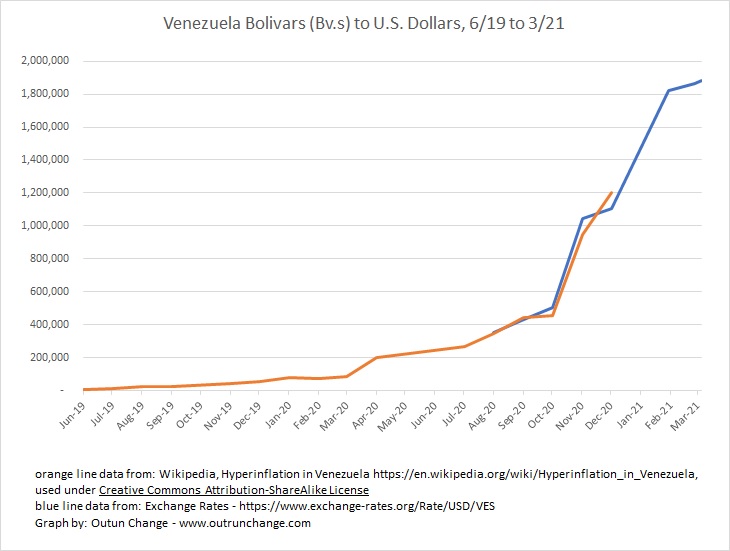
Final graph in this series of posts showing the devastating hyperinflation currently running loose in Venezuela will combine two sets of data.
Purpose of doing so is to see if the two sets of data overlap so that there is some good longer-term information that can be used into the future. The source for current data only goes back to late 2020.
Graph at the top of this post shows exchange rate of Venezuelan Bolivars into US dollars between June 2019 and March 2021. This graph is expressed in Bolivar soberanos (Bv.s).
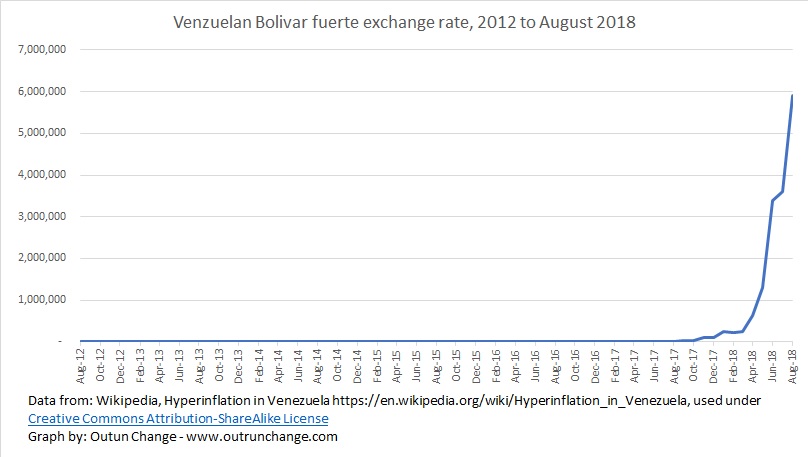
Let’s look at the exchange rate in Venezuela in more detail, breaking out the exchange rate before and after 2018. On the previous graphs it looked like the exchange rate deterioration wasn’t that bad in the lead up to 2018 and it looks like things turned real bad starting in 2019.
That’s the weird thing about hyperinflation. If you remove the recent severe acceleration you still see the rapid increase earlier.
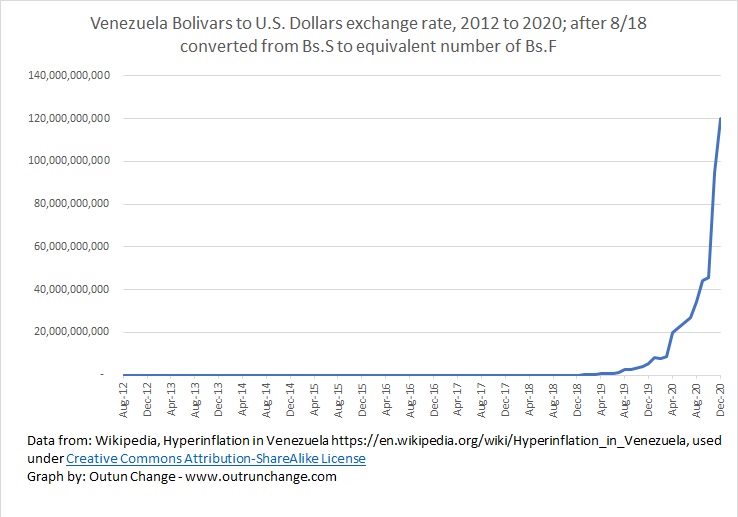
Graph at the top of this post shows exchange rate through 2018. It looks like hyperinflation kicked off in early 2018. Actually, it was going crazy before that. Inflation so severe as to destroy the economy has been running since 2012. Let’s change that graph above to a logarithmic scale to show the percentage changes better.
Hyperinflation is running rampant in Venezuela. Previous post described the deteriorating exchange rate in 2020 and thus far in 2021.
Let’s take a longer-term view to see the devastation of hyperinflation over the course of several years. We will turn to data available from Wikipedia in the article Hyperinflation in Venezuela.
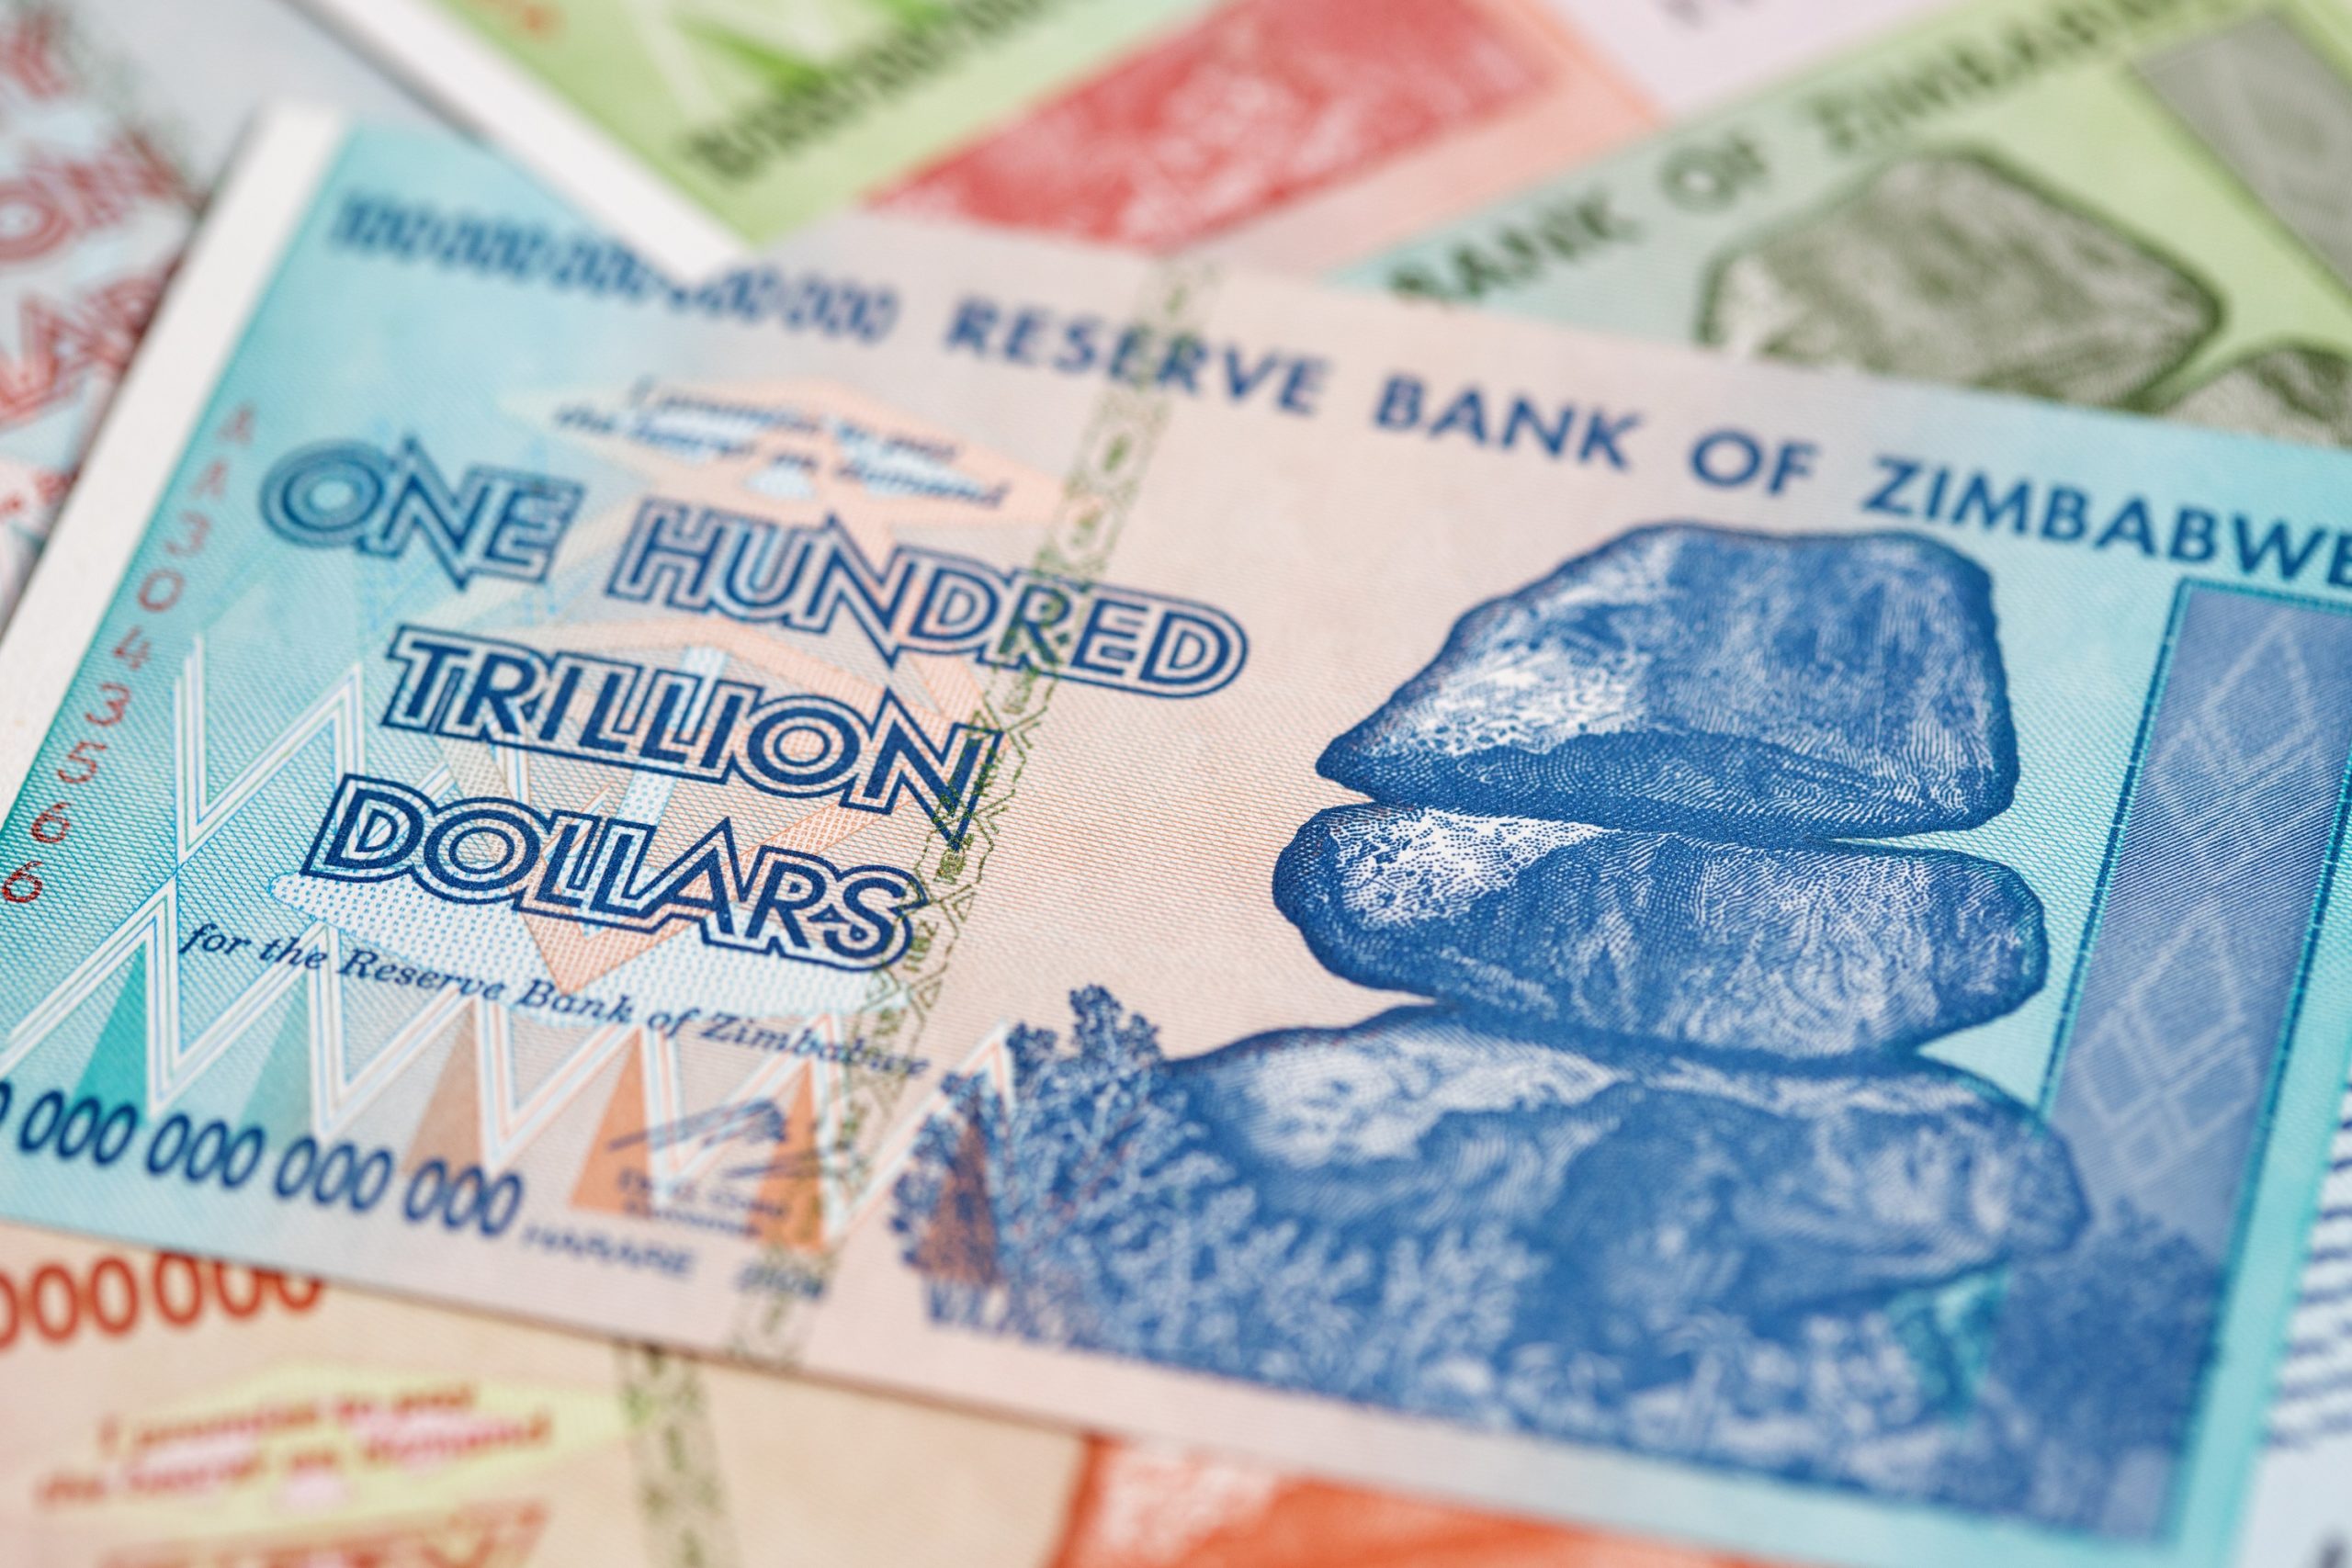
Banknotes of Zimbabwe after hyperinflation. Image courtesy of Adobe Stock.
Socialism in Venezuela has produced the expected results – poverty, a collapsing economy, and people fleeing for their lives. Twenty some odd years of socialism has also produced another foreseeable consequence – hyperinflation.
Let’s track the exchange rate of Venezuelan Bolivars to US dollar as an indicator.
According to Exchange-Rates.org, here is exchange rate of the Venezuelan bolivar to dollar from 9/11/20 through 3/5/21. Here is the month end data:
There is this idea floating around that Sweden, with its high per capita income and high standard of living, is the poster child for successful socialism.
What, oh what, could possibly explain the explosion of prosperity in the last 200 years? Image courtesy of Adobe Stock.
Imagine we could convert the 300,000 year history of Homo sapiens into a 24 hour clock. We could divide the time on that clock into the most recent one minute and the previous 23 hours 59 minutes.
Up until one minute ago, almost every person on the planet was terribly poor. The rare rich person got that way by stealing stuff from the poor. A Viking Jarl or King got that way by plundering the English, Irish, Frankish, or Slavs. The well-to-do in the Roman era stole from conquered countries or lived in luxury on the backs of their abundant slaves.
It has only been in the last minute (meaning the last 200 years) that widespread wealth and prosperity has emerged. That corresponds to the beginning of the Industrial Revolution, if you’re looking for some link and cause.
What is the major difference before and after one minute ago?